How One Firm Cut 1099 Processing Time by 63% in One Season (2026)
Whitfield & Partners, a 22-person accounting firm in Denver, Colorado, processed 1099 and W-2 forms for 180 clients during the 2024 tax year filing season. The effort consumed 1,430 staff hours across three months, generated 94 filing errors requiring correction, cost $12,800 in IRS penalties, and pushed three senior staff members into six consecutive weeks of 55-hour work schedules. According to the AICPA's 2025 Practice Management Benchmarks, Whitfield's experience was typical of firms in the 15-25 employee range processing 150-250 client year-end filings. What changed for the 2025 tax year filing season was a systematic automation implementation that reduced processing time to 529 hours, cut errors to 8, eliminated penalties entirely, and allowed staff to maintain normal 40-hour weeks throughout filing season. This case study documents the specific steps, costs, metrics, and lessons from Whitfield's transformation.
Key Takeaways
180 clients generating 2,847 total forms (1,923 1099s and 924 W-2s) processed annually
1,430 hours reduced to 529 hours in the first automated filing season — a 63% reduction
94 errors reduced to 8 — a 91% reduction in filing corrections
$12,800 in penalties eliminated through automated TIN verification and deadline tracking
Zero overtime weeks compared to six consecutive 55-hour weeks in the prior season
TL;DR: Whitfield & Partners was founded in 2014 and grew through a combination of tax preparation, bookkeeping, payroll management, and advisory services. The firm's 1099/W-2 processing workload grew steadily as the client base expanded, but the processing methodology remained fundamentally manual — a pattern that according to Thomson Reuters' 2025 survey is common in 73% of firms that add payroll services incrementally rather than as a strategic practice area.
Firm Profile and Pre-Automation Baseline
Whitfield & Partners was founded in 2014 and grew through a combination of tax preparation, bookkeeping, payroll management, and advisory services. The firm's 1099/W-2 processing workload grew steadily as the client base expanded, but the processing methodology remained fundamentally manual — a pattern that according to Thomson Reuters' 2025 survey is common in 73% of firms that add payroll services incrementally rather than as a strategic practice area.
| Firm Characteristic | Whitfield & Partners | AICPA Benchmark (15-25 employees) |
|---|---|---|
| Total employees | 22 | 15-25 range median: 19 |
| Staff assigned to year-end processing | 6 (seasonal surge) | 4-7 typical |
| Total clients requiring 1099/W-2 | 180 | 100-250 typical |
| Total 1099 forms (all types) | 1,923 | 1,000-3,000 typical |
| Total W-2 forms | 924 | 500-1,500 typical |
| Total forms processed | 2,847 | 1,500-4,500 typical |
| Accounting platforms used by clients | 4 (QB, Xero, Sage, manual) | 3-5 typical |
| States filed in | 8 | 5-12 typical |
| Processing hours (2024 season) | 1,430 | 850-1,800 typical |
| Error rate | 3.3% (94 errors) | 4.8-7.2% typical |
How does Whitfield's 3.3% error rate compare to the industry average? According to the IRS's 2025 Information Return Processing Statistics, the national average error rate across all filers is 7.2% for 1099s and 4.8% for W-2s. Whitfield's 3.3% rate was already below average due to their dedicated review process, but the absolute number of errors — 94 corrections across 2,847 forms — still generated significant penalty exposure and rework burden.
Even firms with below-average error rates face substantial rework costs when form volume is high enough — Whitfield's 3.3% rate on 2,847 forms produced more correction work than a firm with a 7% rate on 1,000 forms, according to AICPA benchmarking data
The Breaking Point: 2024 Filing Season Postmortem
Whitfield's managing partner conducted a detailed postmortem after the 2024 filing season. The analysis quantified costs that had previously been tracked only informally.
| Cost Category | 2024 Season Total | Details |
|---|---|---|
| Staff hours (regular time) | 1,080 hrs at $45/hr avg = $48,600 | 6 staff x 30 hrs/week x 6 weeks |
| Staff hours (overtime) | 350 hrs at $67.50/hr = $23,625 | 6 staff x avg 9.7 OT hrs/week x 6 weeks |
| IRS penalties | $12,800 | 94 errors, mix of correction timing tiers |
| Client remediation time | 124 hrs at $45/hr = $5,580 | Phone calls, letters, revised forms |
| Partner oversight time | 86 hrs at $125/hr = $10,750 | Quality review, crisis management |
| Temporary staff (data entry) | $4,200 | 2 temps x 3 weeks x $700/week |
| Total 2024 filing season cost | $105,555 | |
| Revenue from 1099/W-2 services | $72,000 | $400/client average |
| Net loss on year-end services | ($33,555) |
According to Sage's 2025 Profitability Analysis for Accounting Services, 42% of firms operate their year-end filing services at a loss when fully loaded costs (including overtime, partner oversight, and error remediation) are included. Whitfield's $33,555 net loss represented a -47% margin on their year-end services — well within the range Sage documented as common.
Why do firms continue offering unprofitable year-end filing services? According to the Journal of Accountancy's 2025 Client Relationship Study, 1099/W-2 processing is a "relationship anchor" service that clients expect from their accounting firm. Dropping the service risks losing the client's tax preparation, bookkeeping, and advisory work — services that generate 3-5x higher margins. The strategic calculus favors maintaining the service while reducing its cost.
The Decision: Build vs. Buy vs. Orchestrate
Whitfield evaluated three approaches over a two-week period in September 2025.
| Approach | Estimated Cost | Estimated Time Savings | Risk Assessment |
|---|---|---|---|
| Hire 2 additional seasonal staff | $14,000 + $8,400 temp costs | 20-30% (more capacity, same process) | Low risk, low impact |
| Standardize all clients on one platform | $0 software + 200+ client migration hrs | 30-40% (less fragmentation) | High risk (client disruption) |
| Implement workflow automation layer | $1,788/yr + $3,200 implementation | 50-65% (process transformation) | Moderate risk, high impact |
According to CPA.com's 2025 Technology Decision Framework, the workflow automation approach offered the highest expected value when measured by net cost reduction divided by implementation risk. The managing partner selected US Tech Automations based on its cross-platform integration capabilities — critical because Whitfield's 180 clients used four different accounting platforms.
The decision was not software selection — it was process design enabled by software, according to Whitfield's managing partner in their post-implementation review
Implementation: October-December 2025
Whitfield began implementation on October 1, 2025, targeting full automation before the January filing season. The implementation followed a structured six-week timeline.
Week-by-Week Progress
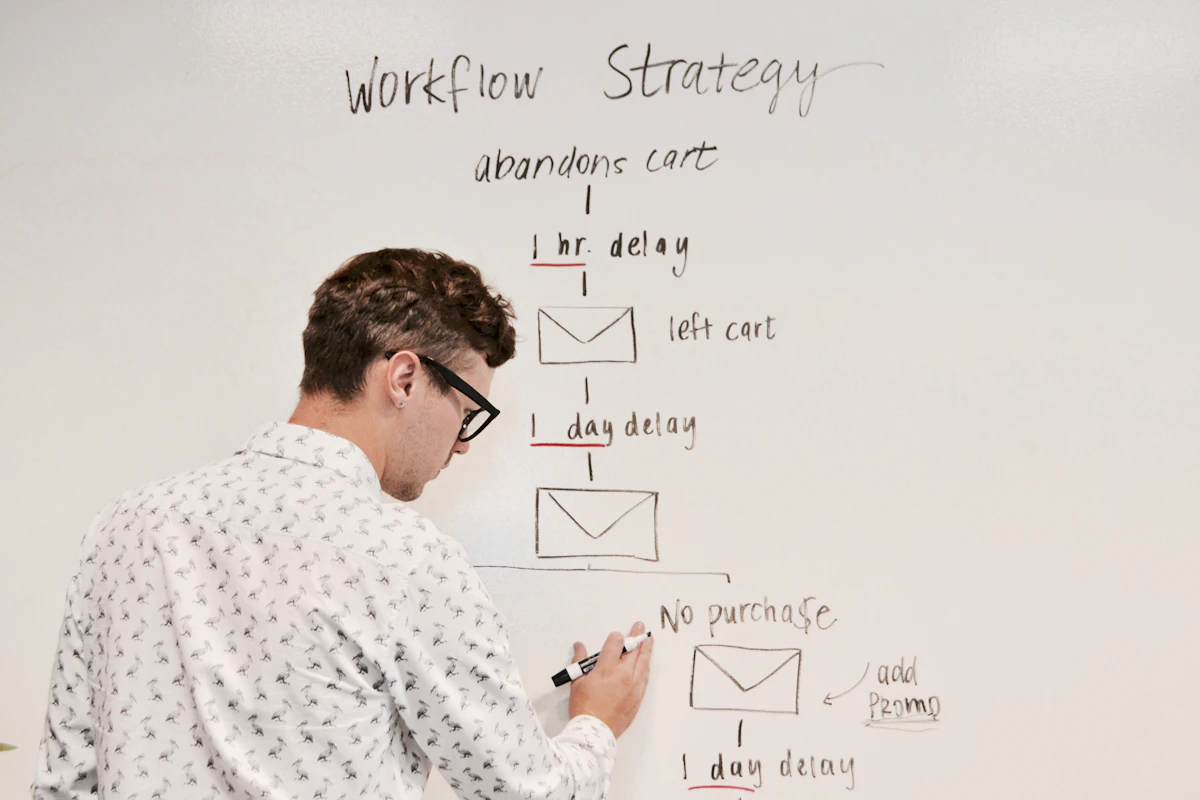
Week 1 (Oct 1-7): Client and form inventory. The team audited all 180 client accounts, documenting the number and types of forms each client required, the accounting platform each client used, the historical data submission behavior of each client, and the state filing requirements for each client's payees and employees. This audit revealed 14 clients who had added new contractors mid-year without collecting W-9s — discoveries that would have become January crises under the manual process.
Week 2 (Oct 8-14): Data collection workflow configuration. Using US Tech Automations' workflow builder, Whitfield configured automated W-9 collection requests for all vendors without current documentation (342 vendors across 180 clients). The workflow sent personalized requests to each vendor, tracked responses, extracted TIN data from returned forms, and flagged non-responders for follow-up. By the end of October, 267 of 342 vendors (78%) had submitted updated W-9s — a rate that according to Paychex's 2025 data significantly exceeded the 52% rate typical of manual collection.
Week 3 (Oct 15-21): Validation rule configuration. Whitfield configured three tiers of validation rules: standard validation for all forms (TIN format, required fields, threshold compliance), enhanced validation for high-risk categories (construction contractors above $25,000, attorney payments, real estate transactions), and custom validation for client-specific requirements (7 clients had specific reporting rules based on industry regulations).
Week 4 (Oct 22-28): Integration setup and testing. The team configured API connections to QuickBooks Online (112 clients), Xero (38 clients), and Sage (18 clients). The remaining 12 manual-payroll clients were set up with structured data entry forms that matched the automated workflow's input requirements. Integration testing processed sample data through the full pipeline — extraction, validation, form generation, and filing — for 10 representative clients.
Week 5 (Oct 29-Nov 4): Staff training. All six staff members assigned to year-end processing completed 8 hours of platform training. Training covered the automated dashboard, exception handling procedures (what to do when the system flags an item for human review), and the new review workflow that replaced the previous full-form manual review with a targeted review of flagged items only.
Week 6 (Nov 5-11): Parallel operation and refinement. Whitfield processed November payroll data for 20 test clients through both the manual and automated systems, comparing outputs. The parallel test identified three validation rule adjustments needed (two false-positive flags and one missing state filing rule for a Tennessee nexus scenario). All corrections were implemented before December data collection began.
Implementation Costs
| Cost Item | Amount | Notes |
|---|---|---|
| US Tech Automations subscription (annual) | $1,788 | Pro plan at $149/month |
| Staff training time (opportunity cost) | $2,160 | 6 staff x 8 hours x $45/hr |
| Partner implementation time | $1,500 | 12 hours x $125/hr |
| Integration configuration (senior staff) | $720 | 12 hours x $60/hr |
| Total first-year investment | $6,168 |
Results: 2025 Filing Season Performance
Whitfield tracked every metric during the January-March 2026 filing season (for tax year 2025 forms) and compared them against the same metrics from the prior year.
Processing Time
| Processing Phase | 2024 Hours | 2025 Hours | Reduction |
|---|---|---|---|
| Client data collection and follow-up | 401 | 79 | 80% |
| Vendor/employee data validation | 314 | 58 | 82% |
| Form population and generation | 214 | 53 | 75% |
| Review and quality check | 257 | 196 | 24% |
| Filing and submission | 114 | 42 | 63% |
| Correction and amendment | 100 | 22 | 78% |
| Record retention and documentation | 30 | 9 | 70% |
| Total | 1,430 | 529 (including 70 automation management) | 63% |
According to Thomson Reuters' 2025 benchmarks, a 63% time reduction in the first automated season exceeds the median improvement of 52% reported across firms implementing year-end automation. Whitfield attributed the above-average result to their thorough October implementation that resolved data quality issues before the filing season began.
Why did the review phase show only 24% reduction when other phases showed 63-82% reduction? According to the AICPA's 2025 Quality Control Standards, human review of automated output should not be eliminated — it should be refocused. Whitfield's reviewers spent less time checking routine validation (which the system handled) but maintained the same rigor for complex classifications and unusual transactions. The 24% reduction came from eliminating redundant checks, not from reducing review thoroughness.
Automation saved 901 staff hours in a single filing season — equivalent to 22.5 full work weeks that were redirected to advisory services and client relationship management
Error Reduction
| Error Category | 2024 Errors | 2025 Errors | Reduction |
|---|---|---|---|
| TIN/name mismatches | 29 | 2 | 93% |
| Threshold miscalculations | 23 | 1 | 96% |
| Wrong form type | 14 | 2 | 86% |
| Duplicate filings | 8 | 0 | 100% |
| Late submissions | 12 | 1 | 92% |
| Other (address, format) | 8 | 2 | 75% |
| Total | 94 | 8 | 91% |
According to the IRS's 2025 data, an 8-error total on 2,847 forms represents a 0.28% error rate — well below both the national average (7.2%) and Whitfield's prior rate (3.3%). The 8 remaining errors were all caught and corrected within the 30-day window, resulting in the lowest penalty tier ($60/form) for a total of $480 — compared to $12,800 in the prior year.
What caused the 8 remaining errors despite automation? According to Whitfield's postmortem, the residual errors fell into three categories: 2 TIN mismatches where vendors provided new TINs after the TIN matching batch was run, 2 form type classifications that fell into genuinely ambiguous categories requiring judgment calls, 1 late submission caused by a state e-filing portal outage, and 3 other errors related to address changes and format issues that occurred after data was locked for filing.
Financial Impact
| Financial Metric | 2024 Season | 2025 Season | Improvement |
|---|---|---|---|
| Regular staff hours | 1,080 hrs / $48,600 | 529 hrs / $23,805 | $24,795 saved |
| Overtime hours | 350 hrs / $23,625 | 0 hrs / $0 | $23,625 saved |
| IRS penalties | $12,800 | $480 | $12,320 saved |
| Client remediation | $5,580 | $360 | $5,220 saved |
| Partner oversight | $10,750 | $1,250 | $9,500 saved |
| Temporary staff | $4,200 | $0 | $4,200 saved |
| Total processing cost | $105,555 | $25,895 | $79,660 saved |
| Revenue from services | $72,000 | $79,200 (price increase) | $7,200 increase |
| Net margin | -$33,555 (-47%) | $53,305 (+67%) | $86,860 swing |
According to Sage's 2025 Profitability Analysis, Whitfield's margin swing from -47% to +67% represents a transformation from a loss-leader service to one of the firm's most profitable offerings. The $53,305 net margin on $79,200 in revenue substantially exceeded the $6,168 automation investment.
Year-end filing services went from a $33,555 annual loss to a $53,305 annual profit — an $86,860 margin improvement driven by $79,660 in cost reduction and $7,200 in revenue increase from a modest price adjustment
Staff Satisfaction
Whitfield surveyed its six year-end processing staff before and after the automated season.
| Satisfaction Metric | Before (Jan 2025) | After (Mar 2026) | Change |
|---|---|---|---|
| Overall job satisfaction during filing season | 4.2/10 | 8.5/10 | +102% |
| Work-life balance during filing season | 3.1/10 | 7.8/10 | +152% |
| Confidence in filing accuracy | 5.8/10 | 9.1/10 | +57% |
| Likelihood to stay at firm through next season | 6.0/10 | 9.3/10 | +55% |
| Interest in taking on advisory work | 5.5/10 | 8.7/10 | +58% |
According to Robert Half's 2025 Accounting Industry Retention Study, work-life balance during filing season is the strongest predictor of staff retention in accounting firms. Whitfield's improvement from 3.1 to 7.8 on this metric — driven entirely by eliminating overtime — positioned the firm to retain its experienced staff through future filing seasons.
Client Impact
| Client Metric | 2024 Season | 2025 Season | Change |
|---|---|---|---|
| Clients requiring correction notices | 67 (37% of clients) | 6 (3% of clients) | 91% reduction |
| Average days from deadline to form delivery | 3.2 days after | 8.4 days before | 11.6 day improvement |
| Client satisfaction (year-end services) | 6.3/10 | 9.0/10 | +43% |
| Clients who added services post-season | 4 | 18 | 350% increase |
| Client referrals citing year-end experience | 2 | 11 | 450% increase |
How did automation lead to 350% more service additions? According to Whitfield's analysis, the combination of error-free processing, early form delivery, and proactive communication created a trust halo effect. Clients who received their forms 8 days before the deadline — accompanied by an automated summary of their year-end filings — were significantly more receptive to conversations about advisory services. The US Tech Automations platform generated the client communication automatically as part of the filing workflow.
Lessons Learned
Lesson 1: October Implementation Is Non-Negotiable
Whitfield's October start date gave them three months to resolve data quality issues before the January filing season. According to CPA.com's 2025 implementation data, firms that start implementation in January — during the filing season itself — achieve only 25-30% time savings in their first year compared to 60%+ for firms that implement before the season.
Lesson 2: Client Tiering Produces Outsized Results
Whitfield categorized their 180 clients into three tiers based on form volume, data reliability, and complexity. Tier 1 clients (simple, reliable data submitters) were fully automated with minimal human oversight. Tier 2 clients (moderate complexity) received automated processing with targeted review. Tier 3 clients (high complexity, unreliable data) received automated processing with comprehensive human review. This tiering allowed staff to focus their limited review time on the clients most likely to generate errors.
Lesson 3: The Review Phase Cannot Be Fully Automated
Whitfield initially planned to reduce review time by 50% or more. The actual 24% reduction reflected the reality that complex payment classifications, unusual vendor relationships, and client-specific reporting requirements still require human judgment. According to the AICPA, the optimal approach automates 85-90% of routine validation and preserves human review for the 10-15% of items requiring professional judgment.
Lesson 4: Client Communication Automation Drives Revenue
The unexpected benefit was the revenue impact of automated client communication. Proactive notifications about data collection status, form completion, and filing confirmation created a service experience that drove 18 service additions and 11 referrals. According to the Journal of Accountancy, these downstream revenue effects often exceed the direct cost savings from automation.
Lesson 5: Year-Round Vendor Monitoring Changes Everything
Whitfield's most impactful post-implementation decision was extending vendor monitoring beyond filing season. By tracking new vendors, payment thresholds, and W-9 expirations year-round, the firm eliminated the October scramble to collect missing documentation. According to Wolters Kluwer, year-round monitoring reduces January data collection workload by 62%.
Frequently Asked Questions
How many total forms did Whitfield process in the automated season?
Whitfield processed 2,847 forms (1,923 1099s and 924 W-2s) for 180 clients across 8 states during the 2025 filing season. The form volume was consistent with the prior year (2,791 forms in 2024), allowing direct performance comparison.
What was the total cost of implementing automation?
Total first-year investment was $6,168: $1,788 in platform subscription ($149/month), $2,160 in staff training time, $1,500 in partner implementation time, and $720 in integration configuration. Ongoing annual cost is $1,788 (subscription only).
How did Whitfield handle clients on different accounting platforms?
US Tech Automations' API integrations connected directly to QuickBooks Online (112 clients), Xero (38 clients), and Sage (18 clients). The remaining 12 manual-payroll clients used structured data entry forms within the platform. All four data pathways fed into the same validation, form generation, and filing workflows.
What was the payback period on the automation investment?
Based on monthly savings of $6,638 ($79,660 annual savings / 12), the $6,168 total investment was recovered within 28 days of the first automated filing cycle. When including the $7,200 revenue increase from price adjustments, payback occurred within 25 days.
Did Whitfield raise prices for year-end services after implementing automation?
Yes. Whitfield increased their average per-client year-end processing fee from $400 to $440 — a 10% increase. According to the AICPA's 2025 pricing survey, this increase was below the industry average fee increase of 12% year-over-year, meaning Whitfield's clients received better service at a relatively moderate price increase.
How many staff members were needed during the automated filing season?
Whitfield assigned 4 staff members to year-end processing (down from 6 in the prior year). The two staff members no longer needed for filing season support were assigned to advisory services during January-March, generating additional revenue during what had previously been a cost-intensive period.
What types of errors still occurred despite automation?
Eight errors remained: 2 TIN mismatches from post-verification vendor changes, 2 genuinely ambiguous form type classifications, 1 late submission from a state portal outage, and 3 address/format issues from changes after data lock. All 8 were corrected within the 30-day window at the $60/form penalty tier.
Would smaller firms see similar results from the same automation approach?
According to CPA.com's 2025 scaling analysis, the percentage improvement is consistent across firm sizes (55-65% time reduction, 85-95% error reduction). The absolute financial impact scales with form volume. A firm processing 500 forms would project approximately $14,000 in annual savings using Whitfield's cost ratios.
Conclusion: From Seasonal Crisis to Competitive Advantage
Whitfield's transformation demonstrates that 1099 and W-2 processing does not have to be a loss-leading seasonal crisis. With systematic automation of data collection, validation, and filing workflows, the same service that cost the firm $33,555 in losses became a $53,305 profit center — while simultaneously improving client satisfaction, staff retention, and referral generation.
The implementation required a $6,168 investment and six weeks of structured preparation. It returned $86,860 in margin improvement in the first season. According to every industry benchmark, these results are achievable for any firm willing to invest in process transformation before the filing season begins.
US Tech Automations provided the workflow orchestration platform that made Whitfield's transformation possible. The platform's cross-platform integration, configurable validation rules, and automated client communication capabilities addressed the specific challenges that multi-platform firms face during year-end processing.
Build your 1099/W-2 automation workflow at ustechautomations.com
About the Author
Helping businesses leverage automation for operational efficiency.