What New Businesses Are Forming in San Francisco?
What new businesses are forming in San Francisco? The sealed municipal record answers that question directly: 2,654 distinct new business registrations captured from March 28, 2026 through June 24, 2026, sealed on June 26, 2026.
A new business registration is a formal municipal filing — a business-license application that marks the first moment a company enters the public record. This report is a census of San Francisco's own municipal dataset only. It is not the city's, the state's, or the nation's new-business total, and must never be presented as one. This metro publishes NAICS codes on its records, so businesses are grouped into 2-digit NAICS sectors read directly from each record's own code — covering 77.9% of the filing stream.
Key Findings
Construction led with 447 registrations at 21.6% of the San Francisco NAICS-coded sector mix, according to the sealed business-formation snapshot.
Accommodation & Food Services placed second with 320 registrations at 15.5% — an unusually high rank for the hospitality sector compared to other tracked metros.
Professional, Scientific & Technical Services produced 263 registrations at 12.7%, reflecting the metro's persistent knowledge-economy base.
77.9% of San Francisco registrations carry a NAICS code, leaving the remaining share unclassified in the sector table.
Real Estate & Rental/Leasing registered 198 firms at 9.6%, a notably elevated share relative to peer metros in this edition.
The Information sector contributed 99 new registrations at 4.8%, a sector that does not appear in the top-sector mix of any other tracked metro.
San Francisco Among the Four Tracked Metros
The sealed snapshot covers 4 metros: Chicago, IL, Los Angeles, CA, New York City, NY, San Francisco, CA. Chicago and New York City publish a free-text licensed activity rather than NAICS codes; their top-category columns reflect a different classification system and are not directly comparable to the NAICS-sector figures shown for Los Angeles and San Francisco.
| Metro | Filings | Code Coverage | Top Sector or Activity |
|---|---|---|---|
| Los Angeles, CA | 4,537 | 97.1% NAICS | Construction (14.8%) |
| San Francisco, CA | 2,654 | 77.9% NAICS | Construction (21.6%) |
| Chicago, IL | 1,948 | 100.0% activity | 180 Day Multiple Events - Special Event Food |
| New York City, NY | 303 | 100.0% activity | Home Improvement Contractor |
San Francisco's Construction share at 21.6% is meaningfully higher than Los Angeles's 14.8%. That gap implies a more trade-concentrated new-entrant mix in San Francisco: a larger fraction of the new businesses entering the formal record are licensed contractors and trade firms, relative to the total filing stream. The Los Angeles formation report explores the near-parity between Construction and Retail Trade in that metro — a contrast to San Francisco's wider lead.
The filing volumes across the 4 metros reflect the scope of each city's municipal dataset. San Francisco's 2,654 filings and Los Angeles's 4,537 are both from NAICS metros; they can be compared on sector mix. Chicago and NYC are activity-labeled metros — their volumes are comparable on count, but their top-category labels come from a free-text field, not a coded taxonomy.
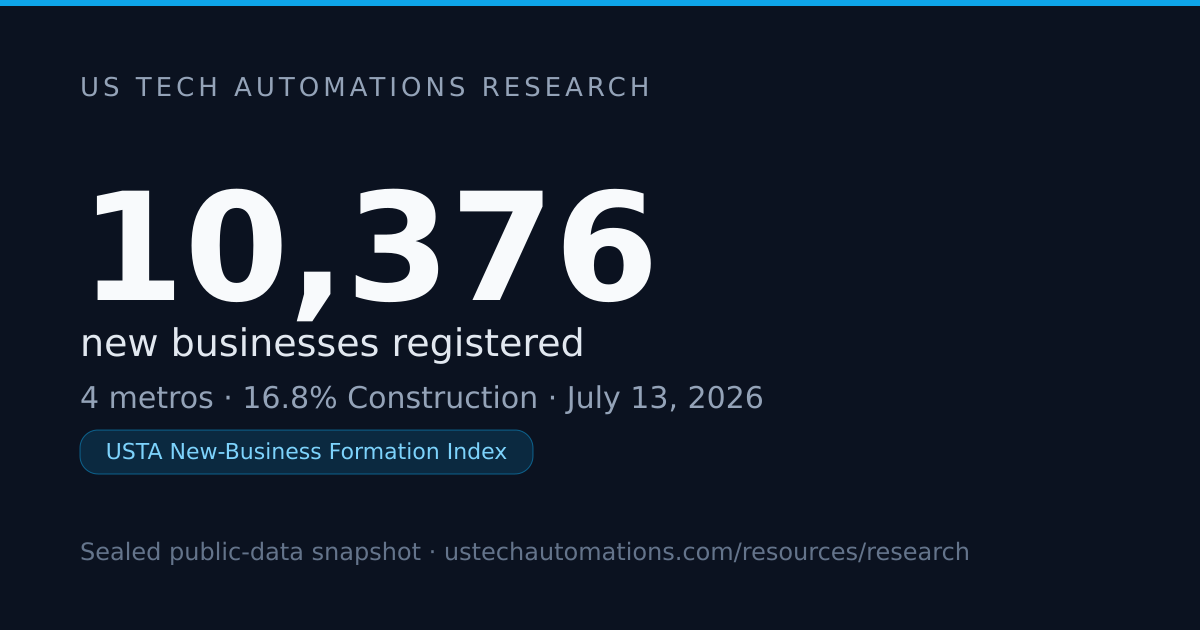
The USTA New-Business Formation Index places these four metros in a single view and walks the national-of-tracked sector distribution.
Construction claimed 447 registrations in San Francisco, leading with a 21.6% share.
San Francisco New Registrations at a Glance
| Metric | Value |
|---|---|
| Total Registrations (window) | 2,654 |
| Collection Window | March 28, 2026 – June 24, 2026 |
| NAICS Code Coverage | 77.9% |
| Top Sector | Construction |
| Snapshot Date | June 26, 2026 |
This is a cross-sectional census only. Each registration is counted once, at first observation, from San Francisco's open municipal business-license dataset. No figures have been estimated, modeled, or extrapolated. The sector breakdown covers the 77.9% of filings that carry a NAICS code; the remainder appear only in the total count.
The Sector Picture: Where New SF Businesses Land
The NAICS-coded sector breakdown reveals a profile shaped by both the physical economy and the city's hospitality density.
| NAICS Sector | Registrations | Share |
|---|---|---|
| Construction | 447 | 21.6% |
| Accommodation & Food Services | 320 | 15.5% |
| Professional, Scientific & Technical Services | 263 | 12.7% |
| Retail Trade | 217 | 10.5% |
| Real Estate & Rental/Leasing | 198 | 9.6% |
| Educational Services | 126 | 6.1% |
| Information | 99 | 4.8% |
| Arts, Entertainment & Recreation | 92 | 4.4% |
Accommodation & Food Services placed second at 15.5% — 320 new SF registrations.
Construction leads by a wider margin than it does anywhere else in the tracked metro set. In San Francisco's context, this covers general contractors, specialty trade subcontractors (electrical, plumbing, roofing, HVAC), and residential renovation firms. The city's persistent housing-renovation and commercial-tenant-improvement activity generates a recurring flow of new contractor registrations as firms establish a local license presence. A materials supplier or trade-staffing firm monitoring the feed gains an early view of new contractor entrants.
Accommodation & Food Services at 15.5% is the distinctively high figure in the San Francisco mix. Restaurants, cafes, food-hall operators, and short-term rental managers register at a rate that puts food and hospitality into a firm second place — ahead of Professional Services. In most metros of comparable size, this sector ranks lower. Its elevated position here reflects both the density of food-service establishments in San Francisco neighborhoods and the frequency with which new operators register as they enter the market.
Real Estate & Rental/Leasing at 9.6% stands out against peer metros. This sector covers property management firms, real estate brokerages, and short-term rental operators registering as distinct business entities. Its share in San Francisco is nearly double the rate visible in the Los Angeles sector mix. Whether driven by the housing-market churn or by property managers formalizing multi-property operations, it represents a specific niche for B2B vendors serving property professionals.
The Information sector at 4.8% — covering software publishers, internet companies, data processing firms, and media organizations — appears in the San Francisco sector mix but does not register as a top sector in the Los Angeles or Chicago datasets. Its presence signals a distinct flavor of new-entrant activity tied to the metro's technology-economy character. This is a general sectoral observation; the source data provides a NAICS code, not a business description or funding stage.
Professional, Scientific & Technical Services at 12.7% captures management consultants, engineering firms, legal practices, IT services, and accounting offices. Educational Services at 6.1% — tutoring centers, specialized schools, and training providers — adds another sector that does not appear prominently in the LA or Chicago top-sector mixes.
The NAICS coverage of 77.9% means roughly one in five registrations in the filing stream carries no code in the source dataset. Those records appear in the 2,654 filing total but not in any sector row. No sector has been inferred for uncoded records. See the San Francisco building permit report for the physical-construction pipeline alongside this formation signal.
77.9% of San Francisco registrations carry a NAICS code in this sealed snapshot.
How the Data Is Collected and What It Covers
Source: US Tech Automations business-formation clock (new-business registrations from open municipal Socrata datasets, captured daily and content-hashed).
Scope statement: New business registrations (the new-filing stream, excluding renewals) captured from the open municipal business-license datasets of Chicago, IL, Los Angeles, CA, New York City, NY, San Francisco, CA by our business-formation clock between June 26, 2026 and June 26, 2026. This is a census of those four municipal datasets, not of every business formed in the United States or in any single state.
Honesty statement: Every count is a verbatim count of distinct business registrations the clock actually captured; nothing is estimated, modeled or extrapolated. Each formation is counted once at first observation. NAICS sectors are grouped from the first two digits of each record's own NAICS code (SF and LA carry NAICS; Chicago and NYC publish a free-text activity, summarized separately). Figures describe the tracked metros only and must never be presented as a city-wide, statewide or national total.
NAICS coverage note: The sector table covers only records that carry a NAICS code — 77.9% of San Francisco's filing stream. Records with no code are included in the 2,654 filing total but are not assigned to any sector row. No sector has been inferred for uncoded records.
Cross-sectional only. The clock is new. All figures represent a single sealed observation window (March 28, 2026 – June 24, 2026). No month-over-month, year-over-year, or trend claims are possible or intended.
Collection steps:
Collect. The clock queries San Francisco's open municipal Socrata dataset daily, pulling new-filing records by registration date.
Normalize and deduplicate. Each registration receives a unique identifier. Records already observed in a prior daily pull are excluded — each business is counted once, at first observation.
Classify. The first two digits of each record's own NAICS code determine the sector assignment. No re-coding or inference is applied. Records with no code remain uncategorized.
Seal. The daily aggregate is content-hashed and appended to the time-series store. Snapshot SHA: b67b5cf69feaa9f73bc4ef1cfe3269ce881ca2f3f1a898648e2e61f7d660dc57.
Frequently Asked Questions
Q: How does San Francisco's Construction share compare to Los Angeles?
A: San Francisco's Construction sector represents 21.6% of NAICS-coded registrations, versus 14.8% in Los Angeles for the same snapshot period. The gap suggests a more trade-concentrated new-entrant mix in SF. Both figures cover only NAICS-coded records and only the respective city's municipal dataset — they should not be read as a comparison of every contractor in each metro.
Q: Why does this snapshot cover only 77.9% of filings with NAICS codes?
A: The source dataset — San Francisco's open municipal business-license feed — does not carry a NAICS code on every record. Those records without a code are included in the 2,654 total filing count but cannot be assigned to a sector. No sector has been inferred or estimated; the gap simply reflects the coverage available in the source.
Q: What does an elevated Real Estate & Rental/Leasing share signal?
A: At 9.6%, Real Estate & Rental/Leasing represents property management firms, real estate brokerages, and rental operators registering as formal business entities. This sector's share in San Francisco is notably higher than in the Los Angeles mix, where it registers at 4.9%. Whether that reflects property-market churn, investors formalizing multi-unit operations, or new brokerage entrants is not determinable from the NAICS code alone — the signal is sector-level only.
Q: What counts as a new registration in San Francisco's municipal dataset?
A: The dataset captures new business-license filings, not renewals. Each record represents the first formal registration of a business entity in the municipal system. The clock captures each at first observation and does not re-count them in later daily pulls. Businesses registered through state-level entities only — without a municipal license filing — are not in this dataset.
Q: Who would monitor the Information sector data from San Francisco and why?
A: B2B vendors targeting early-stage tech and media firms — legal-tech platforms, business-insurance brokers, HR-software vendors, and accounting practices — would monitor Information sector registrations as a signal of new-company formation in their target segment. At 99 new registrations in this window, the sector provides a focused, actionable list of recently formalized entities, earlier in their life than any funding database would capture.
Q: Is this the same data that appears in the national Formation Index?
A: Yes. The San Francisco figures in this post are a metro-level slice of the same sealed snapshot that feeds the USTA New-Business Formation Index. The index post presents aggregate totals and a cross-metro leaderboard using the same sealed figures. The AI Price Index report covers a parallel data stream from the same research infrastructure.
Put Formation Data to Work
Three buyer types gain recurring value from daily access to the San Francisco formation feed.
B2B revenue leads at software, payroll, or commercial-supply vendors set sector-filtered alerts on the municipal registration feed. When a new Construction or Accommodation & Food Services registrant appears — 447 and 320 filings in this window respectively — they route first-touch outreach the same business day. These are companies at the moment of formation: they have not yet selected payroll systems, POS platforms, or insurance providers. Early contact, before a purchase decision is made, is the compounding advantage this signal provides.
Commercial real estate brokers and property-services vendors track the Real Estate & Rental/Leasing sector (198 filings at 9.6%). Each new property-management or brokerage registration is a potential tenant, a new vendor account, or a referral source. A recurring weekly scan of new Real Estate registrations in San Francisco provides a prospecting list that would otherwise require cold list purchases or directory scraping.
Business insurers and financial-services firms monitor the Professional, Scientific & Technical Services sector (263 filings at 12.7%) and the Information sector (99 filings at 4.8%) for newly registered knowledge-economy companies in need of professional-liability coverage, business banking, and accounting services. In a market where these firms are often well-capitalized from their first day, early contact matters more than in the general small-business population.
US Tech Automations automates this signal routing by watching the municipal registration feed daily, filtering by sector, and drafting first-touch outreach — so teams reach new founders before any competitor knows the business exists.
Start routing San Francisco formation signals automatically
Source: US Tech Automations Research — computed from the sealed daily business-formation snapshot, June 26, 2026.
Get this data as a daily feed
The numbers in this report come from a permit feed we monitor daily. Leave your email and we will follow up about a daily feed for your ZIPs and categories.
Prefer to talk first? Contact us.
Cite this report
US Tech Automations Research, 2026-06 edition. “What New Businesses Are Forming in San Francisco?.” https://ustechautomations.com/resources/blog/new-business-formations-san-francisco
Sealed snapshot sha256: b67b5cf69feaa9f73bc4ef1cfe3269ce881ca2f3f1a898648e2e61f7d660dc57
Machine-readable data: CSV · JSON · All research & methodology
About the Author

Helping businesses leverage automation for operational efficiency.